Peab
Annual and quarterly reports since 2016, and much of InPublix's development history.
Peab's reports are complex: many people involved at different levels, two languages, and high demands on layout and design. I have worked with Peab's report teams since 2015, and much of what InPublix can do today was developed in that collaboration.
- Nine annual reports (2016–2024) in Swedish and English, each with a digital and a print version, plus around 30 quarterly reports
- Quarterly reports generated as PDF straight from the web content
- Annual reports produced for print through the InPublix–InDesign round-trip, which was initiated for Peab's needs and then used in live report production
- WordPress (InPublix)
- InDesign integration
Communication & UX
Users, content and communication
Proofreading where the content lives
With many people reviewing the same report, the hard part was proofreading. Peab needed to proofread in the web version and at the same time get designed, laid-out PDFs for proofing rounds and board meetings. Changes between versions are marked with track changes, so reviewers see exactly what has changed in texts and tables.
Figures entered once
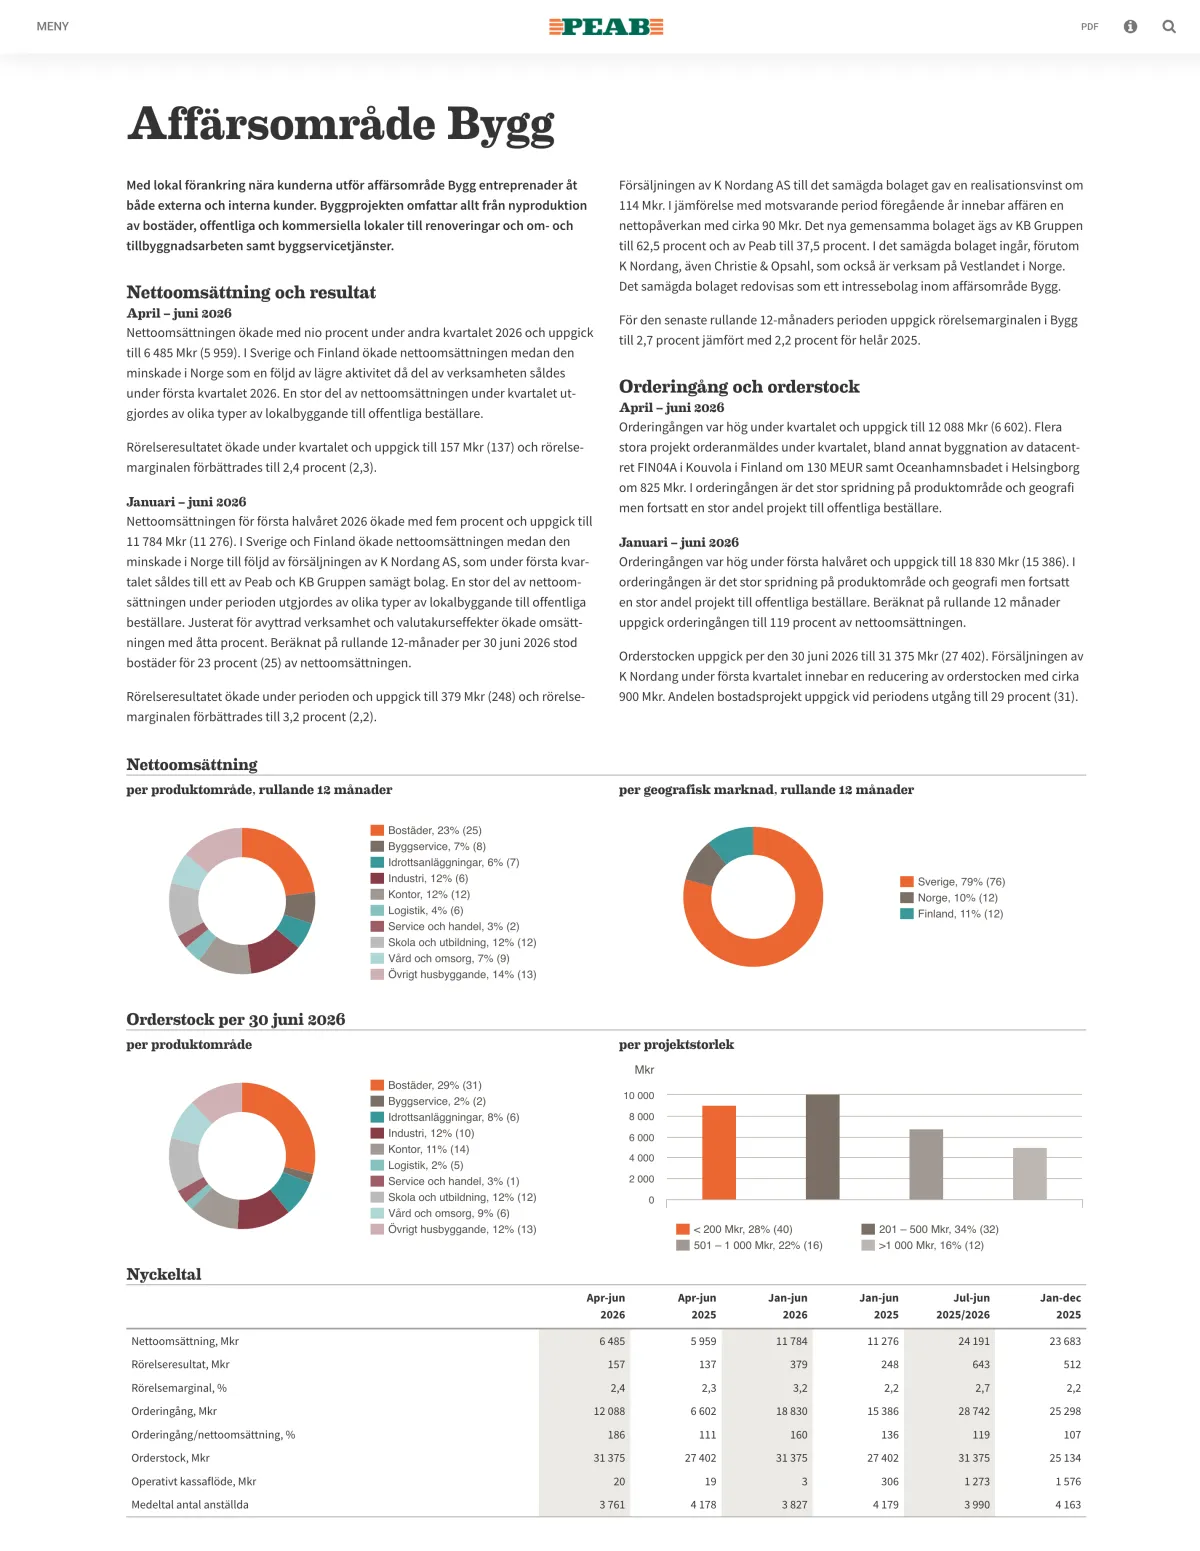
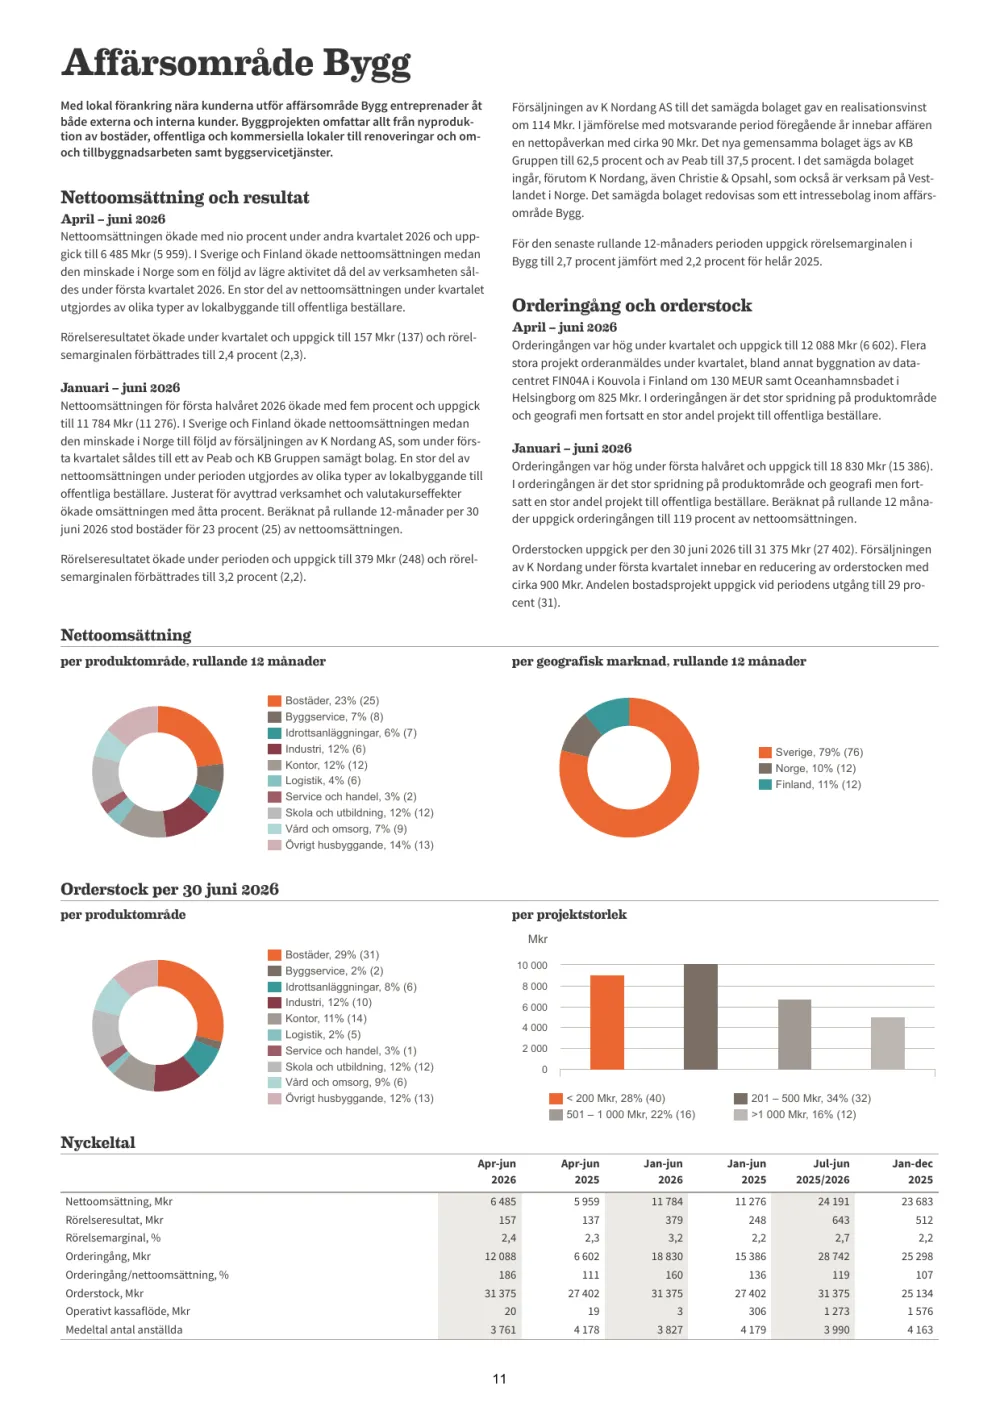
The bilingual tables let the report team enter a figure once and have it formatted correctly in both Swedish and English. The charts come from a separate WordPress plugin I built and developed continuously with Peab: each chart has its own data table and its own settings for chart type, colours, bars, legends and so on, all rendered dynamically with Highcharts.
Process
How the work was done
A long collaboration
The collaboration started in 2015, with annual reports from 2016 and quarterly reports from 2017 and onwards, digital and in InDesign. Working with the same report team year after year meant that problems found in one report could be solved in the platform before the next.
From client need to shared platform
The InDesign round-trip, the chart plugin and the bilingual tables were all driven by Peab's needs, then generalised into InPublix so that other clients benefited too. Alongside InPublix, I worked on Peab's annual reports in InDesign, in dialogue with their finance and IR functions about structure, content and process. For the 2025 annual report, the first produced in Workiva, my part was limited.
Presentation
Platform in production
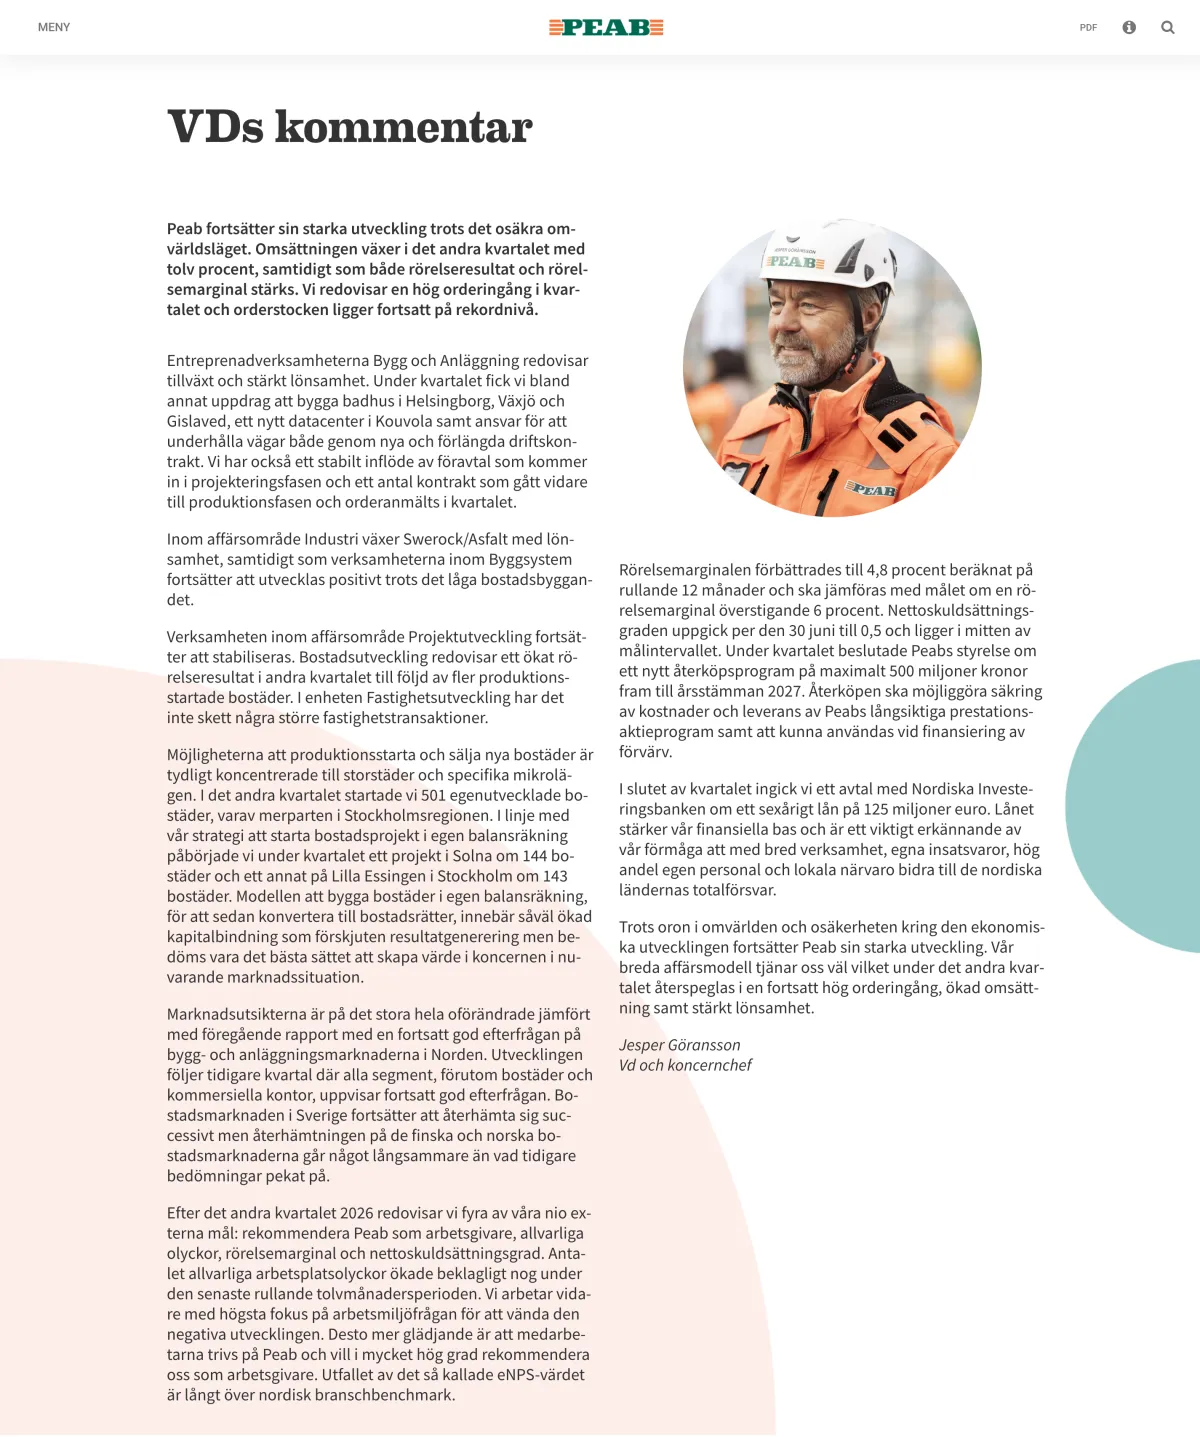
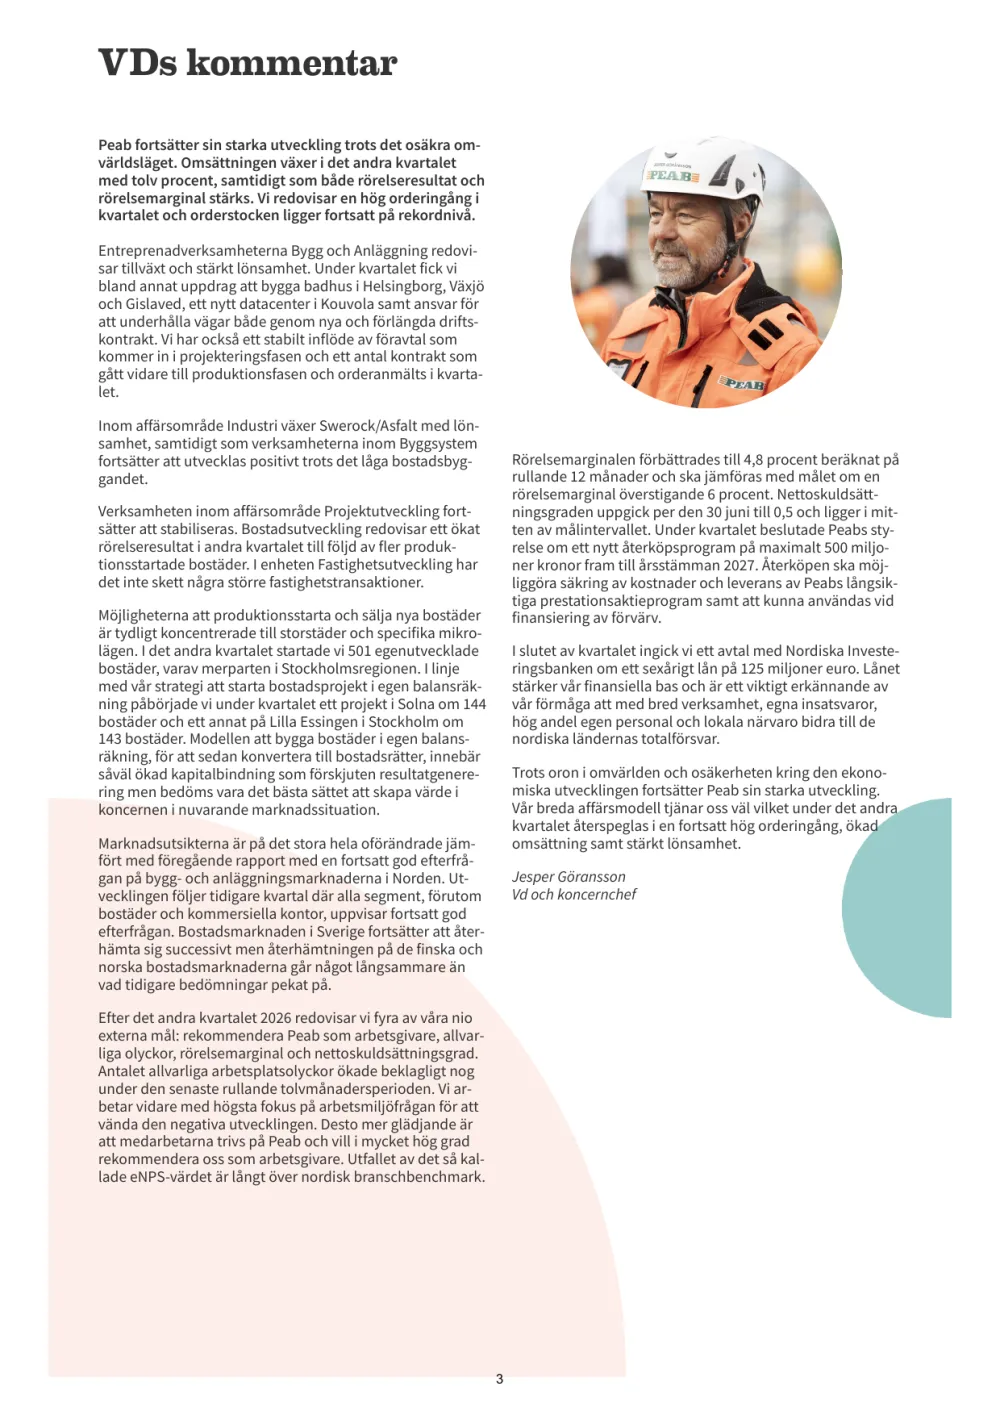
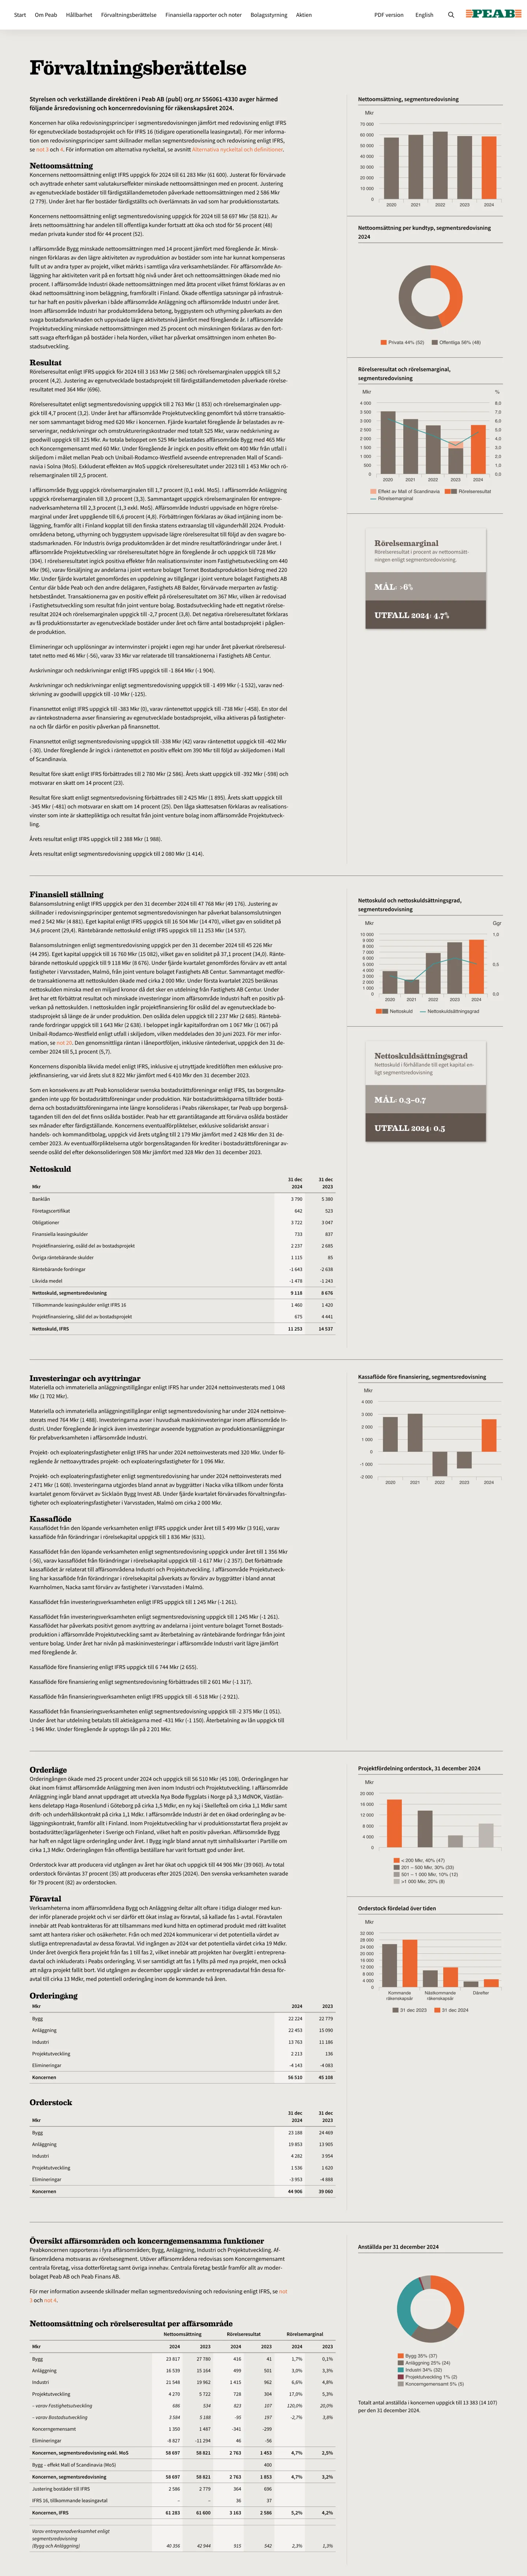
Peab's reports are public, so the screens below are taken straight from the live sites. The annual reports for 2016–2024 are still online on InPublix, and the quarterly reports continue there. From the 2025 annual report, Peab produces its annual report in Workiva.
Annual Report 2024The last annual report on InPublix, 134 pages in Swedish and English (opens in new tab) Half-year Report 2026The latest quarterly report on InPublix (opens in new tab) Half-year Report 2026 as PDFGenerated straight from the web content of the quarterly report (opens in new tab)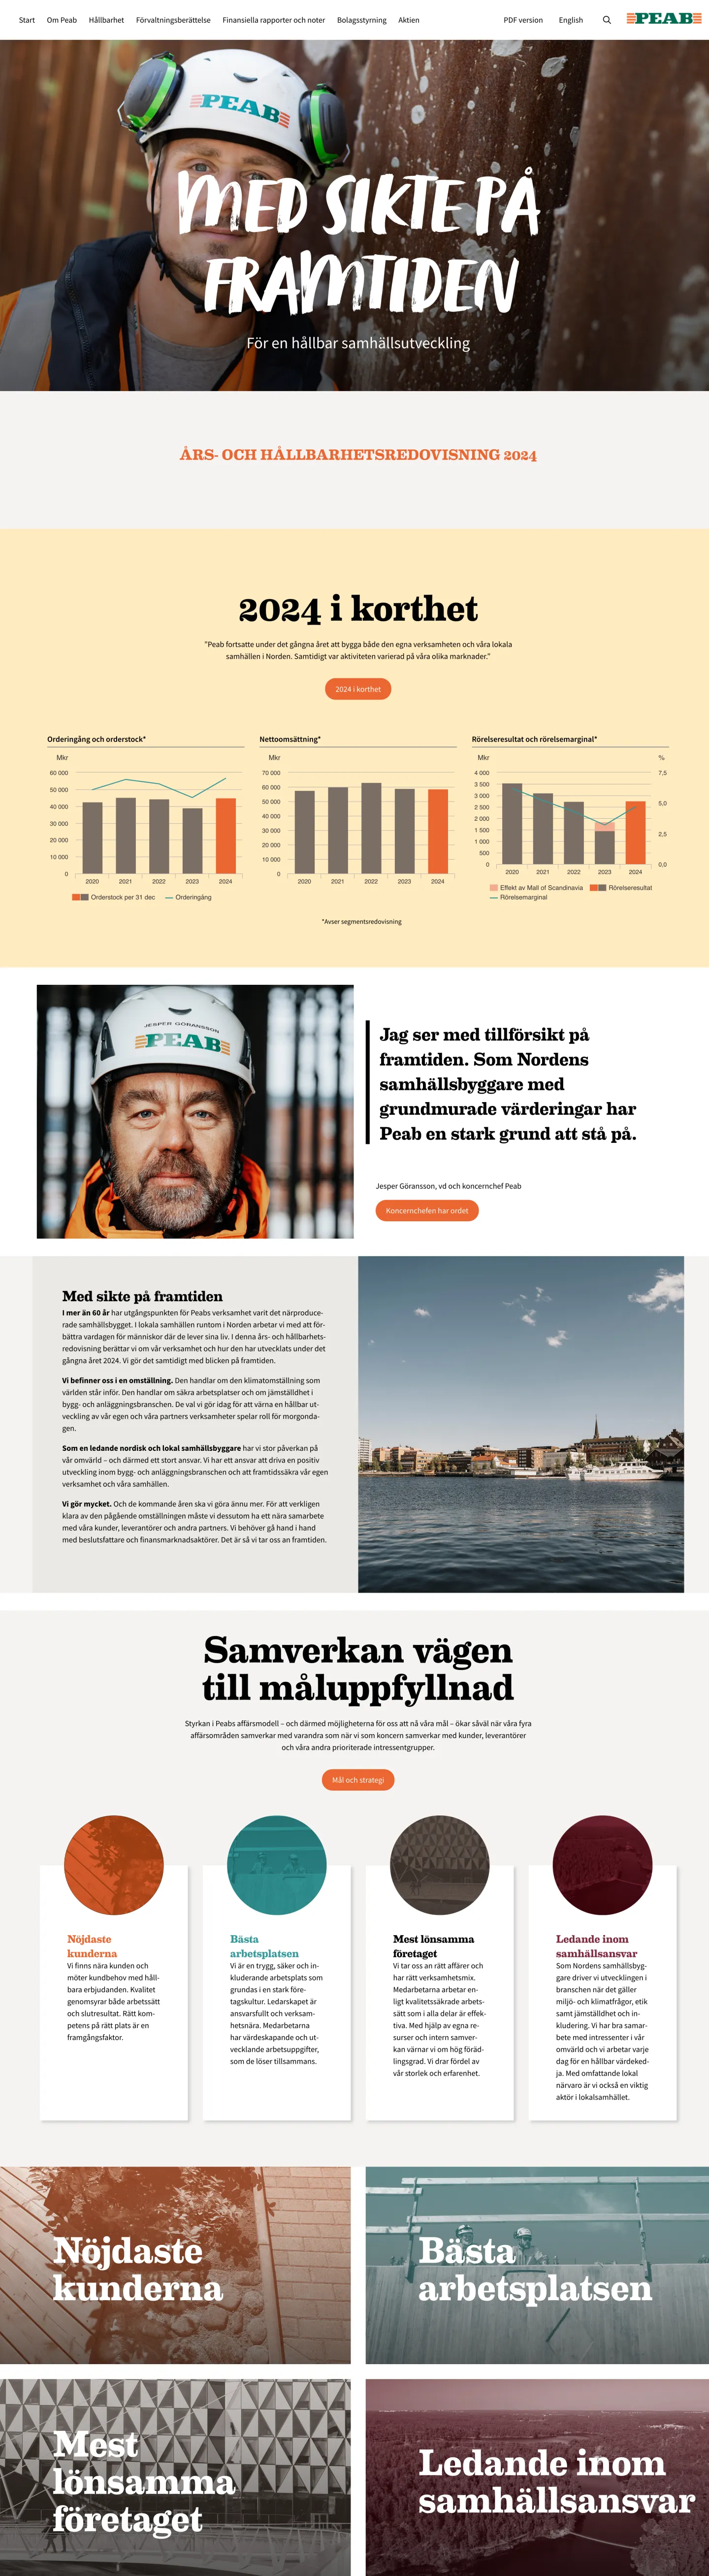
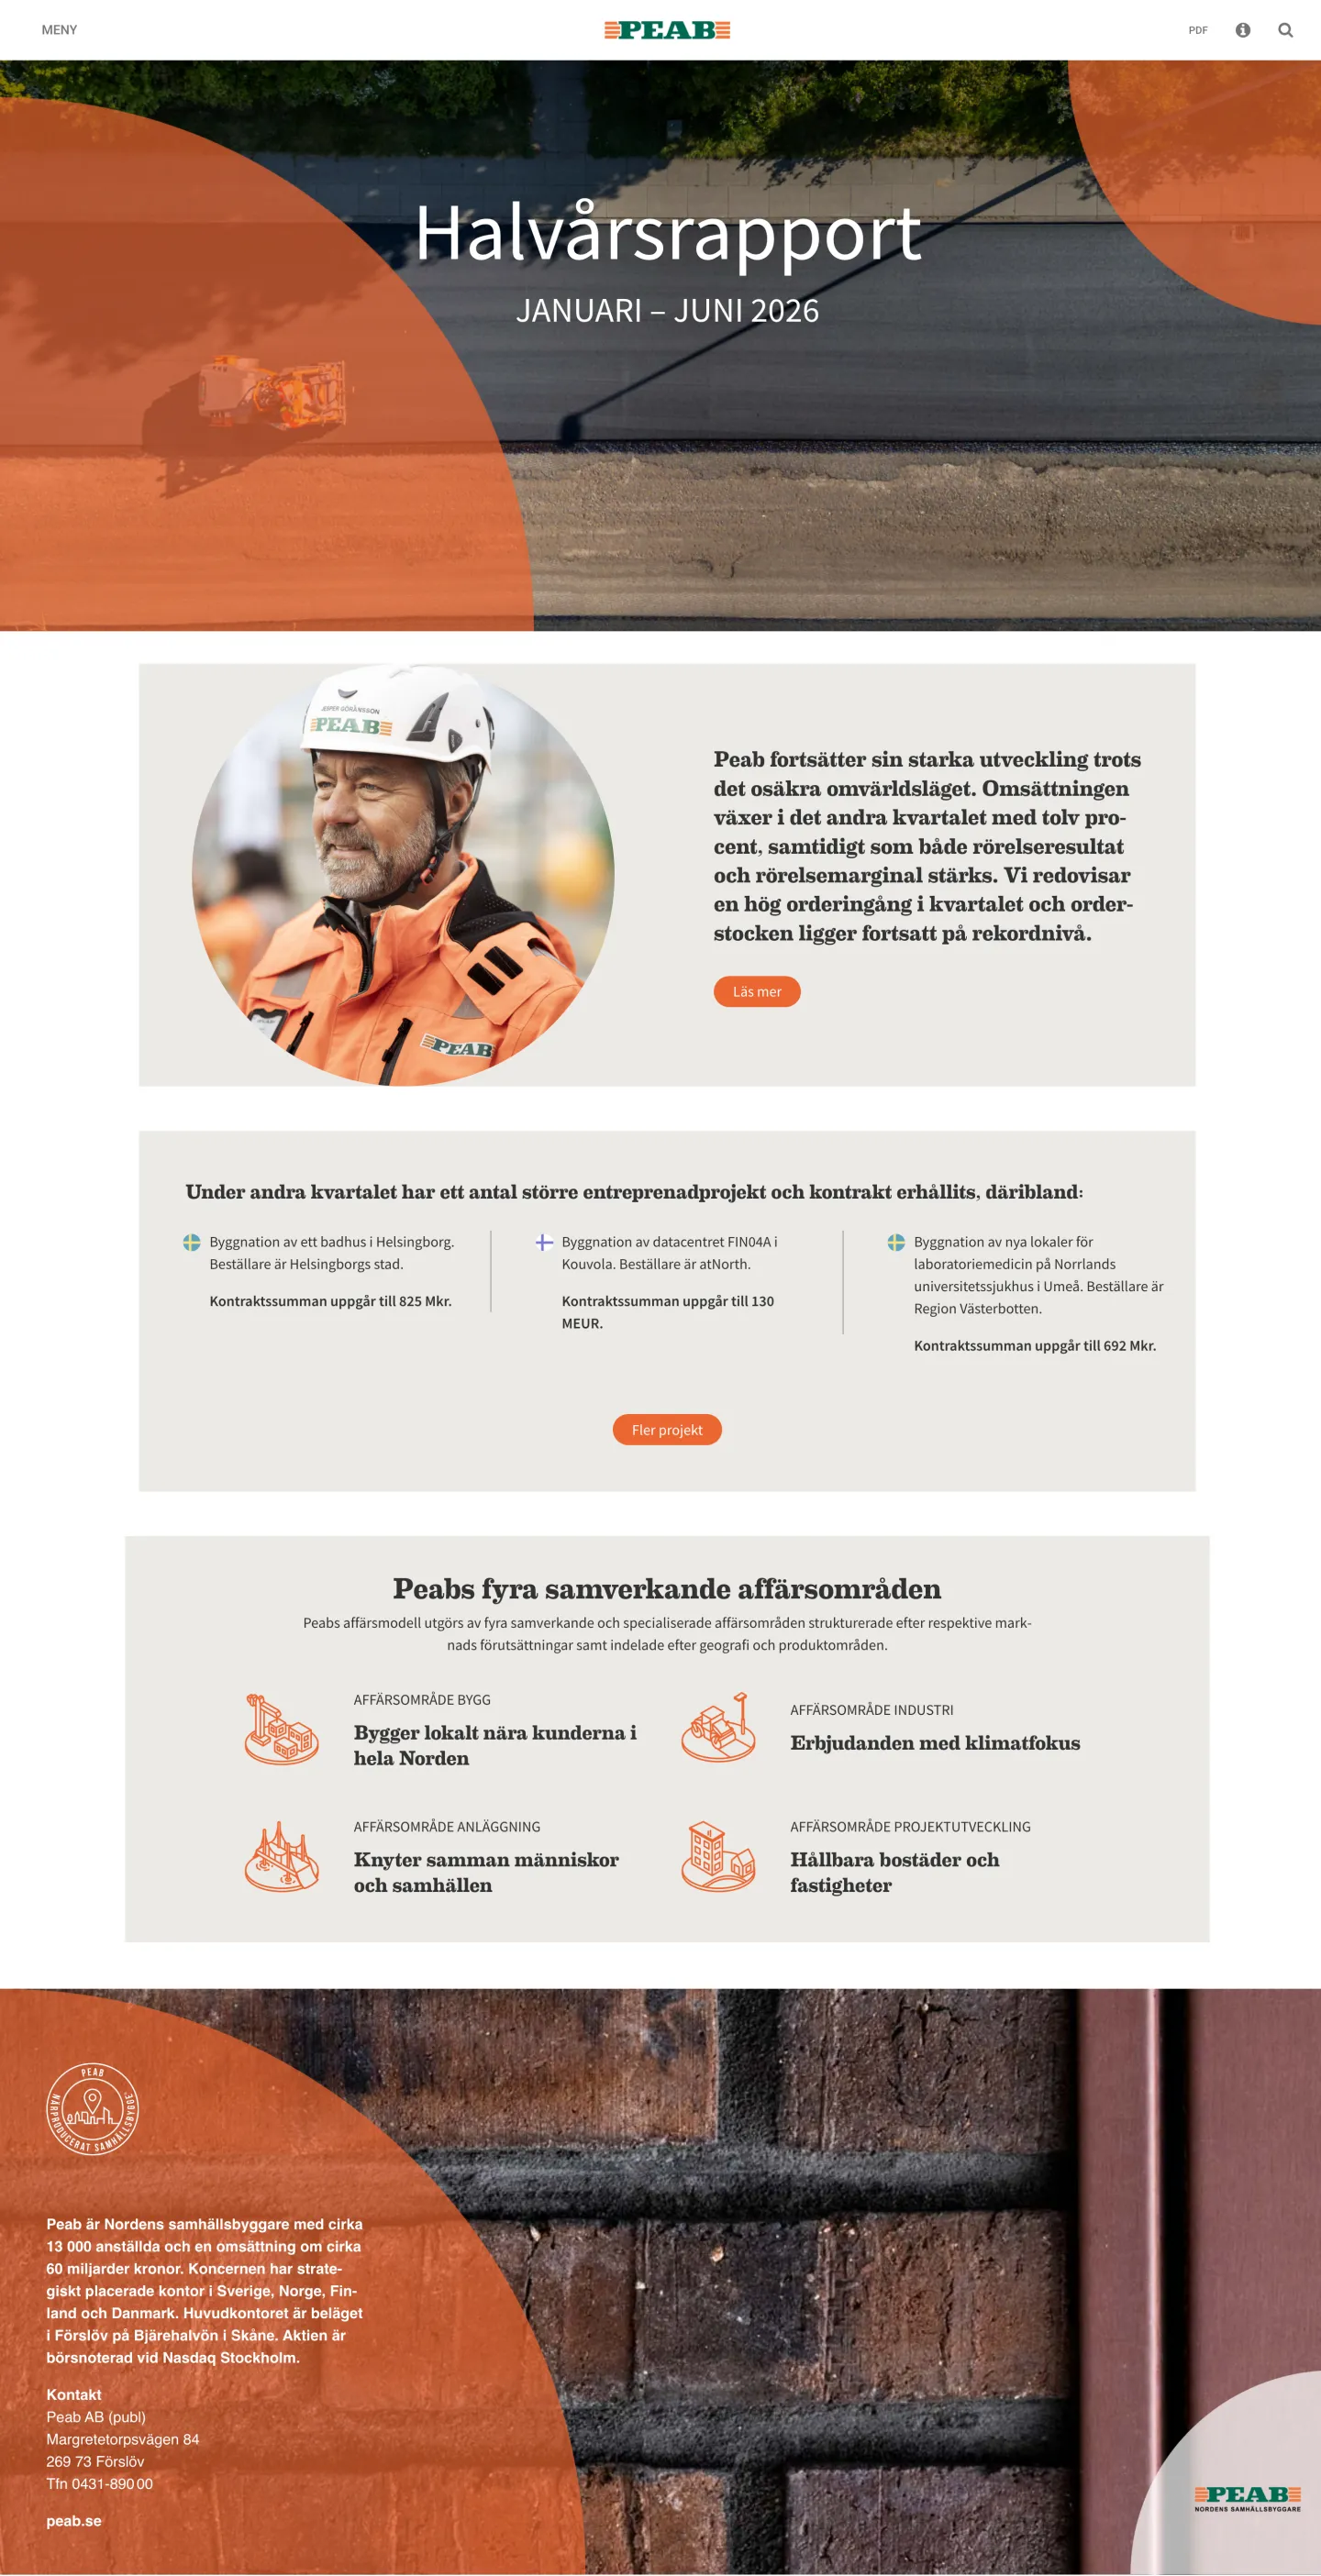
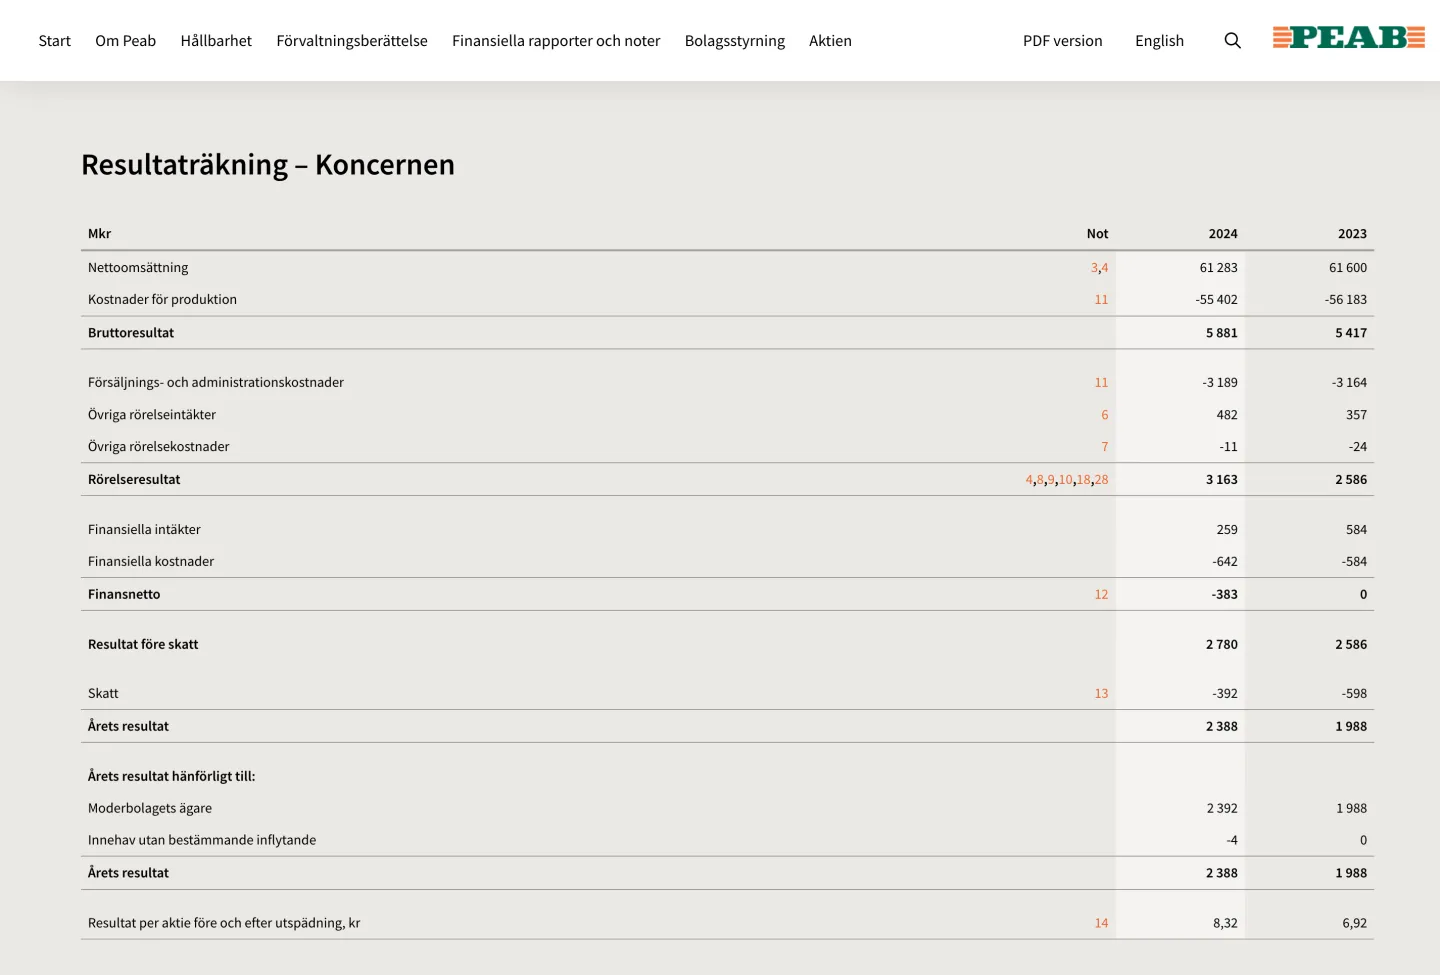
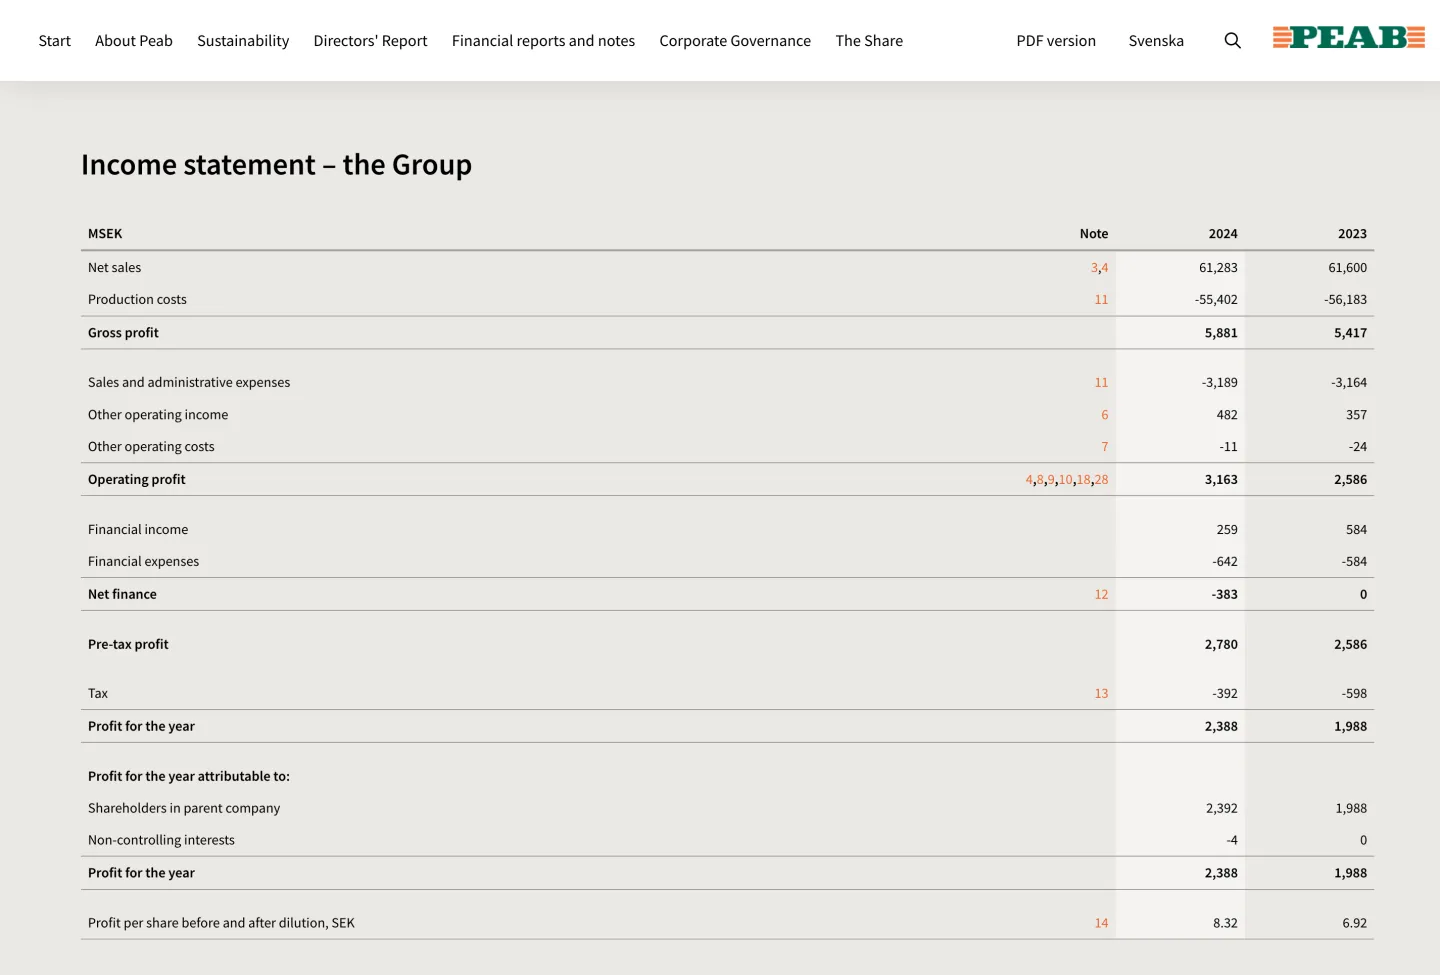
The PDF of each quarterly report is not a separate layout. It is generated straight from the same web content, so text, tables and charts only need to be produced once. Two pages from the half-year report, on the web and in the PDF: